Measuring the Impact of Increased Political Representation on Castes in Nepal

Federalism and Caste Representation in Post-Revolution Nepal
Key Insights
- Following the People's War and promulgation of a new federal constitution in 2017, a large contingent of historically underrepresented Nepalis became politicians.
- While nominees, candidates, and eventually elected officials were more representative of the population, this greater representation in most cases did not provide greater access to earthquake reconstruction funds for underrepresented groups.
- More educated politicians were better able to direct benefits to households in their wards; politician education appears to have a large and positive impact on constituent benefits.
Background
Nepal’s armed struggle from 1996-2006 ended the country’s 240-year old monarchy. In 2015, following a deadly earthquake that rocked the country, a new federal constitution ushered in multi-party federal democracy. The Maoist party, whose members led the revolution, competed in the 2017 elections at all levels of government for the first time. At the same time, the new constitution delegated more powers and responsibilities to municipal governments, paving the way for electoral outcomes at local levels to impact households directly.
Our analysis combines data from a 2015 post-earthquake needs assessment census (comprising 2.5 million individuals across 11 districts), a list of nominees for political office provided by the electoral commission (comprising more than 15,000 candidates and 4,000 elected representatives), and data on earthquake reconstruction transfers. We also conducted a survey of 705 party selection committee members, part of which included a special computer-assisted Implicit Association Test that provides a measure of bias related to caste, education level, or gender. Together, these data shed light on how historically excluded castes were represented in the 2017 elections, and how caste identity, education, and bias helped (or hindered) a given household’s ability to access earthquake reconstruction benefits.
Key Findings
Finding 1: Historically underrepresented groups made gains in the 2017 election, with some mixed results
Representation for the historically underrepresented, non-Hindu Janajati group improved during the 2017 election, with the share of Janajati nominees reflecting their population share. However, Janajati’s were less likely than elite castes to be nominated for leadership positions (i.e. Municipal Mayors or Ward Chairpersons). Selection committees with more Janajatis also had nominee pools with more Janajatis. This could be because they directly recruit more Janajatis, or because Janajatis are more likely to put their names forward if they know the committee selecting them is more like them.
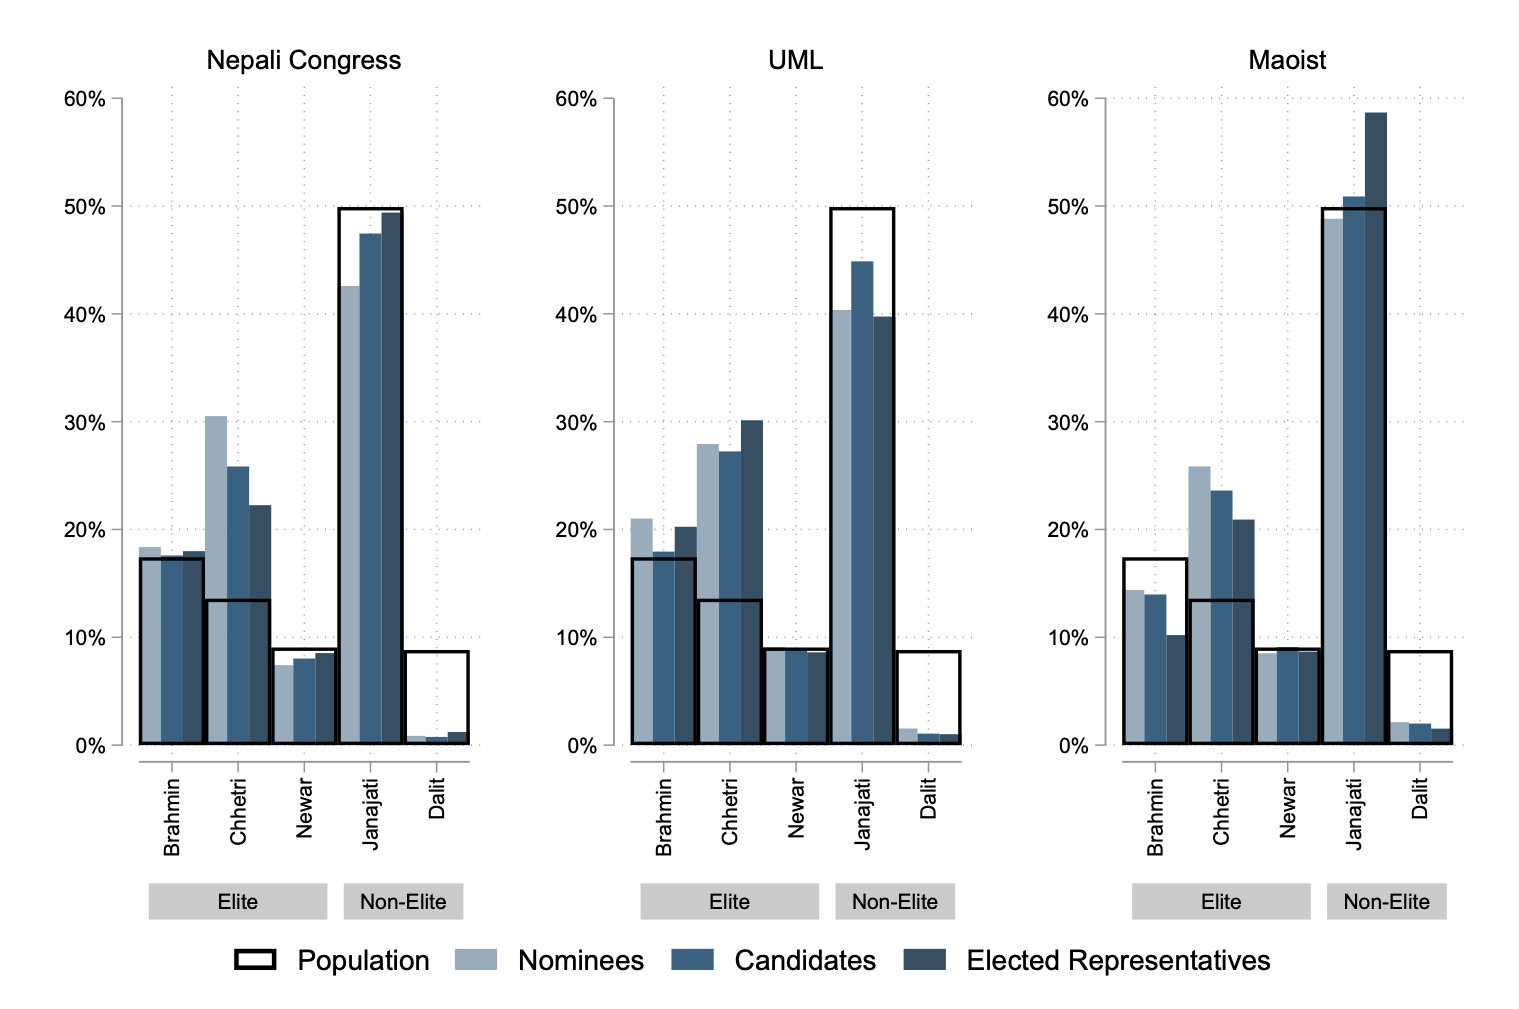
The Maoist party was an important conduit for Janajati representation. 60% of Maoist party nominees were Janajati, vs. 40% for the United Marxist-Leninist (UML) or Nepali Congress (NC). In figure 1, the transparent black bars represent the share of the general population in each caste group, while the blue-hued bars represent the share of politicians in each group. A solid bar that extends above the black bar indicates that that caste group was overrepresented. A solid bar below the corresponding black bar indicates a caste group was underrepresented. All three parties were over-represented by elite castes (Brahmin, Chhetri, and Newar groups). The Maoist party (far right) was proportionately represented among nominees, while their elected representatives were disproportionately Janajati.
Elite castes were generally over-represented in the election, but this is likely due to their higher income status and education levels. Approximately 3 in 1,000 Janajatis were nominees for a political position, compared to 3.7 in 1,000 elites. However, once we consider who selection committees actually chose as candidates, both groups were roughly equal in representation.

Figure 1: Politician Caste Representation
Finding 2: Nominees and elected representatives were better educated, in general
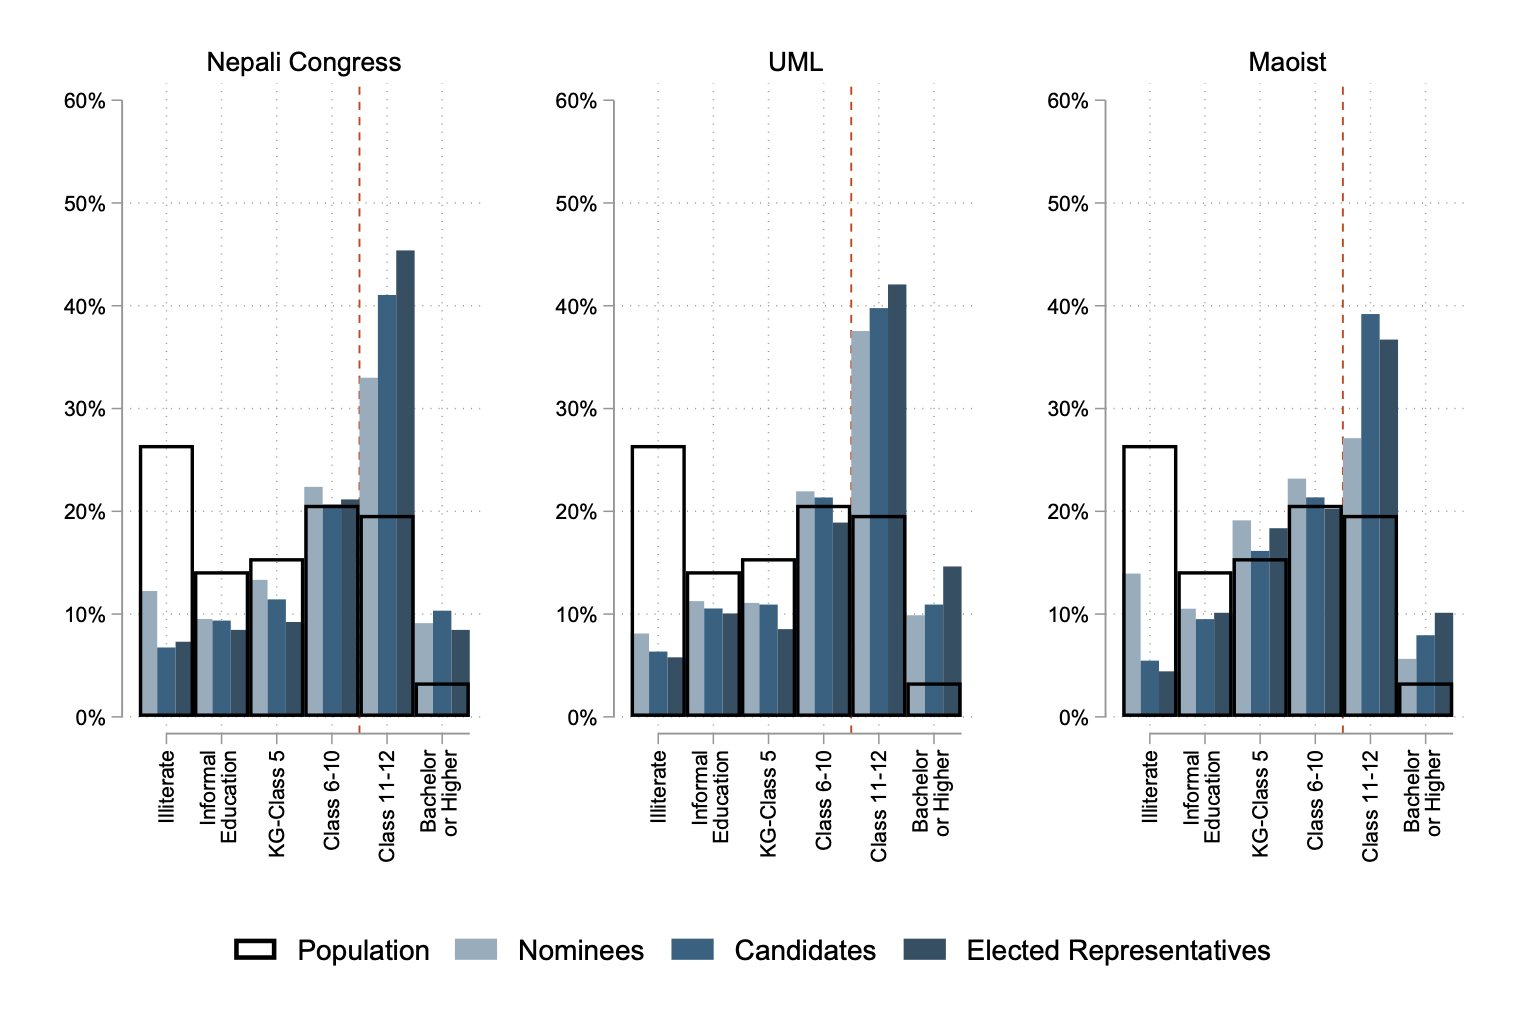
Janajati nominees were better educated, on average, than the general population, but less well educated than other castes’ nominees. Maoist nominees were less educated than other parties (though still more educated than the general population). However, those Maoists who ran and were elected were slightly better educated than their UML peers. In figure 2, the black bars represent the proportion of the population with the corresponding level of education, while solid bars are the share of politicians with that level of education. All parties had politicians disproportionately more educated than the general population, but Maoists were slightly more in line with the general population.

Figure 2: Politician Education
Finding 3: The election results reflect biases in favor of elites
Committee members across all parties had some bias in favor of elite castes, but Janajati members were less biased. Maoists were just as biased as all other parties. However, Maoist Janajatis who serve on selection committees were less biased than Janajatis from the other two main parties who served on selection committees.
Finding 4: Historically underrepresented groups receive fewer reconstruction benefits, though having a highly-educated representative helps
Janajati households receive lower reconstruction benefit payouts than elite caste members, even when they share the caste of the Mayor or Ward Chair, though doing so lessens the discrepancy. Janajatis do worse but connected Janajatis don’t do as badly. In close elections, highly educated Ward Chairs can redirect more benefits to their constituency than lower-educated opponents.